
Wavefront field note
AI Demand Forecasting for Retail: A Practical 2026 Pilot Guide
Pilot AI demand forecasting with stockout-aware data, backtesting, lead-time controls, and human-approved retail reorder recommendations.
By Daniel Michaelis · 2026-08-27

AI demand forecasting estimates what customers may buy by SKU, location, channel, and time period so planners can make better replenishment, allocation, promotion, and staffing decisions. A reliable pilot does not ask a general-purpose chatbot how many units to order. It combines trustworthy transaction and inventory data with an appropriate forecasting method, tests the predictions against held-out history, explains the drivers, and keeps purchase orders under human approval until performance is proven.
The commercial context is large and current. The National Retail Federation forecasts 2026 U.S. retail sales of $5.6 trillion, up 4.4% from 2025. Ecommerce adds channel complexity, while promotions, stockouts, returns, supplier delays, weather, and local events can distort simple averages.
Recent merchant discussions show the real decision criteria. A Shopify merchant managing about 900 SKUs described running out of bestsellers while over-ordering slow movers. Responses focused on stockout correction, promotion tagging, supplier-specific lead times, open purchase orders, and visible reasoning. Those practitioner comments guide the questions in this article; they are not treated as universal performance data.
Key Takeaways
- Clean the demand history before comparing models.
- Segment SKUs instead of forcing one method on everything.
- Backtest recommendations before risking purchase-order money.
- Combine forecasts with lead times, safety stock, and inbound inventory.
- Keep buyers responsible for overrides and purchase approval.
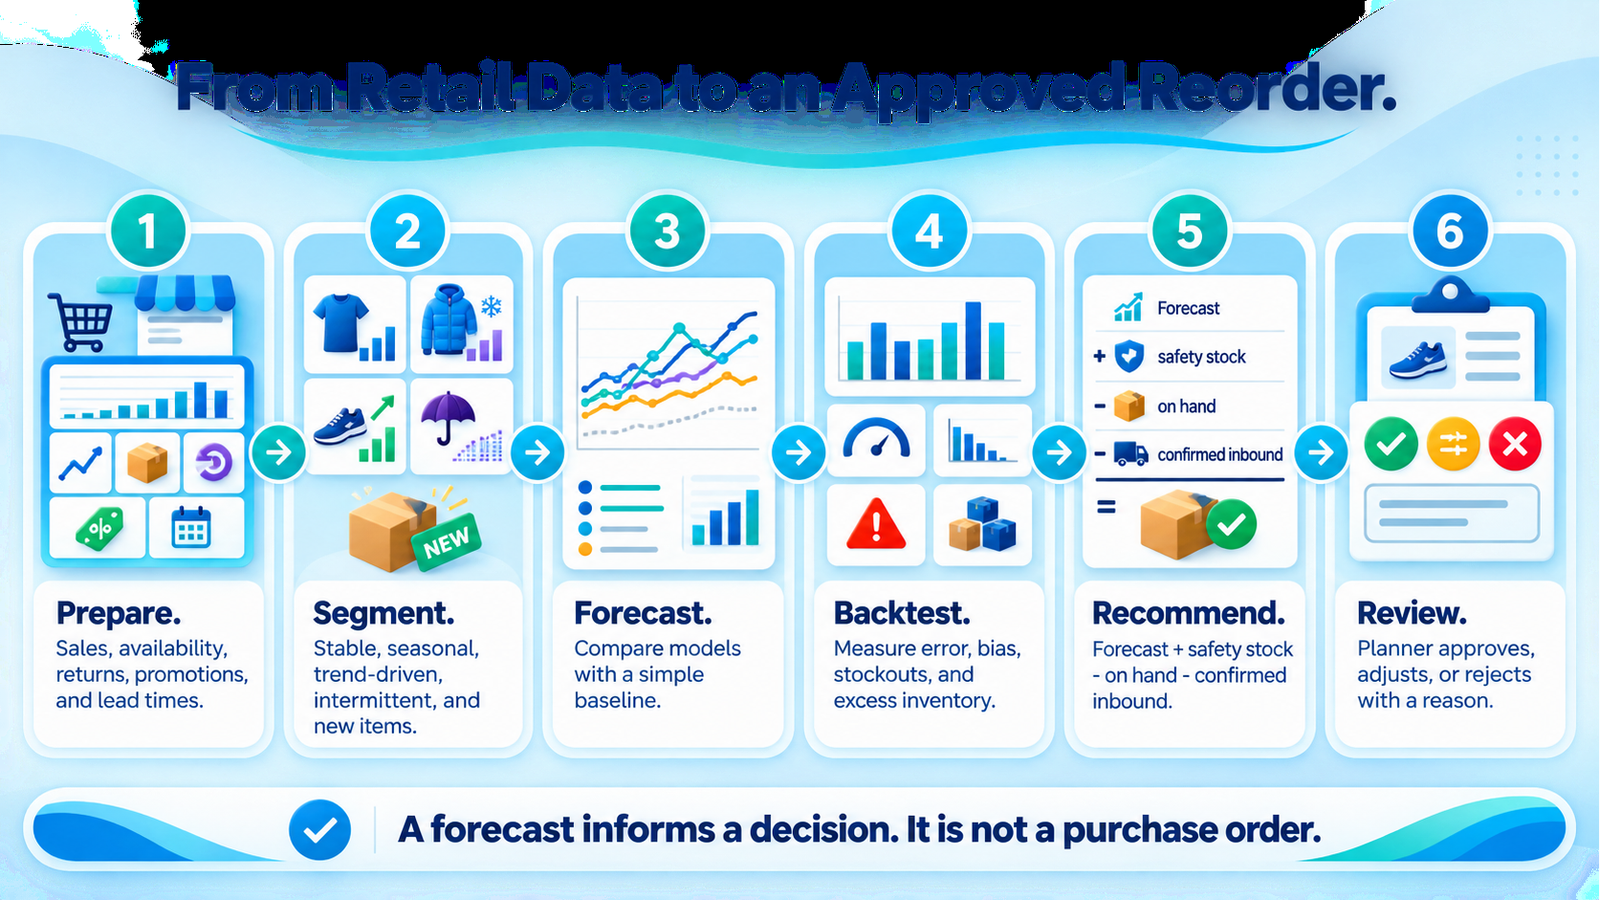
Step 1: Define the decision the forecast will support
By the end of this step, the team should know who will use the forecast, what decision it informs, how often it refreshes, and what horizon matters.
“Forecast sales” is too broad. Choose one decision:
- Replenish core ecommerce SKUs for the next supplier lead-time window
- Allocate inventory across stores or warehouses
- Prepare staffing and fulfillment capacity for a campaign
- Identify likely stockouts early enough to act
- Flag excess inventory for merchandising review
Record the current process, decision owner, cadence, constraints, and error cost. Under-forecasting may cause lost sales and poor service. Over-forecasting may tie up cash, increase storage, and force markdowns. The acceptable tradeoff differs by category, margin, shelf life, substitution, and supplier flexibility.
Choose a pilot slice with enough history and business importance but manageable complexity. Twenty to fifty representative SKUs across fast, slow, seasonal, promoted, and intermittent demand can teach more than a rushed rollout across the entire catalog.
Step 2: Reconstruct demand, not just recorded sales
By the end of this step, the training data should distinguish actual low demand from sales that were impossible because inventory was unavailable.
Start with:
- Orders, units, prices, discounts, cancellations, and returns
- Inventory on hand by location and date
- Stockout and availability periods
- Open purchase orders and expected receipts
- Supplier and lane lead times
- Product launches, retirements, bundles, and substitutions
- Promotion and marketing calendars
- Store, channel, and fulfillment changes
- Relevant external signals such as weather or local events
If a bestseller was out of stock for two weeks, recorded sales during that period are not a clean demand signal. Treating the zeros as lack of demand can cause the next order to be too small, creating a repeating stockout loop.
Audit IDs, time zones, returns, channel duplication, bundles, and historical changes. Freeze a documented data snapshot for the pilot so teams can reproduce the evaluation.
Step 3: Segment products and choose a baseline
By the end of this step, each pilot SKU should be assigned to a meaningful demand pattern and compared with a simple baseline.
Useful segments include:
- Stable core items
- Seasonal items
- Trend-driven products
- Intermittent or low-volume products
- New products with limited history
- Promotion-sensitive items
- Perishable or short-life inventory
Do not assume the most complex model will win. Establish baselines such as seasonal naive, moving average, exponential smoothing, or the current planner method. Then test candidate statistical or machine-learning models under the same time windows and data rules.
A model that slightly improves average error but behaves badly on top-revenue items may be a poor business choice. Evaluate by segment, location, and decision impact.
Shopify's July 2026 guide describes a broad input set that includes POS and ecommerce orders, inventory and lead times, 3PL data, promotions, pricing history, weather, social trends, and economic indicators. Use external signals only when they add stable predictive value in your own backtest. More data is not automatically better data.
Step 4: Backtest the forecast and the decision
By the end of this step, the team should know how the proposed system would have performed on historical periods it did not train on.
Use rolling backtests that mimic real operations. Train only on information that would have been available at each forecast date, then predict the next lead-time or planning horizon. This prevents leakage from future data.
Track multiple measures:
| Measure | Why it matters |
|---|---|
| Weighted absolute percentage error | Emphasizes items with more volume |
| Bias | Shows consistent over- or under-forecasting |
| Service level or fill rate | Connects predictions to availability |
| Stockout days | Captures lost availability |
| Excess units or weeks of supply | Captures cash and storage exposure |
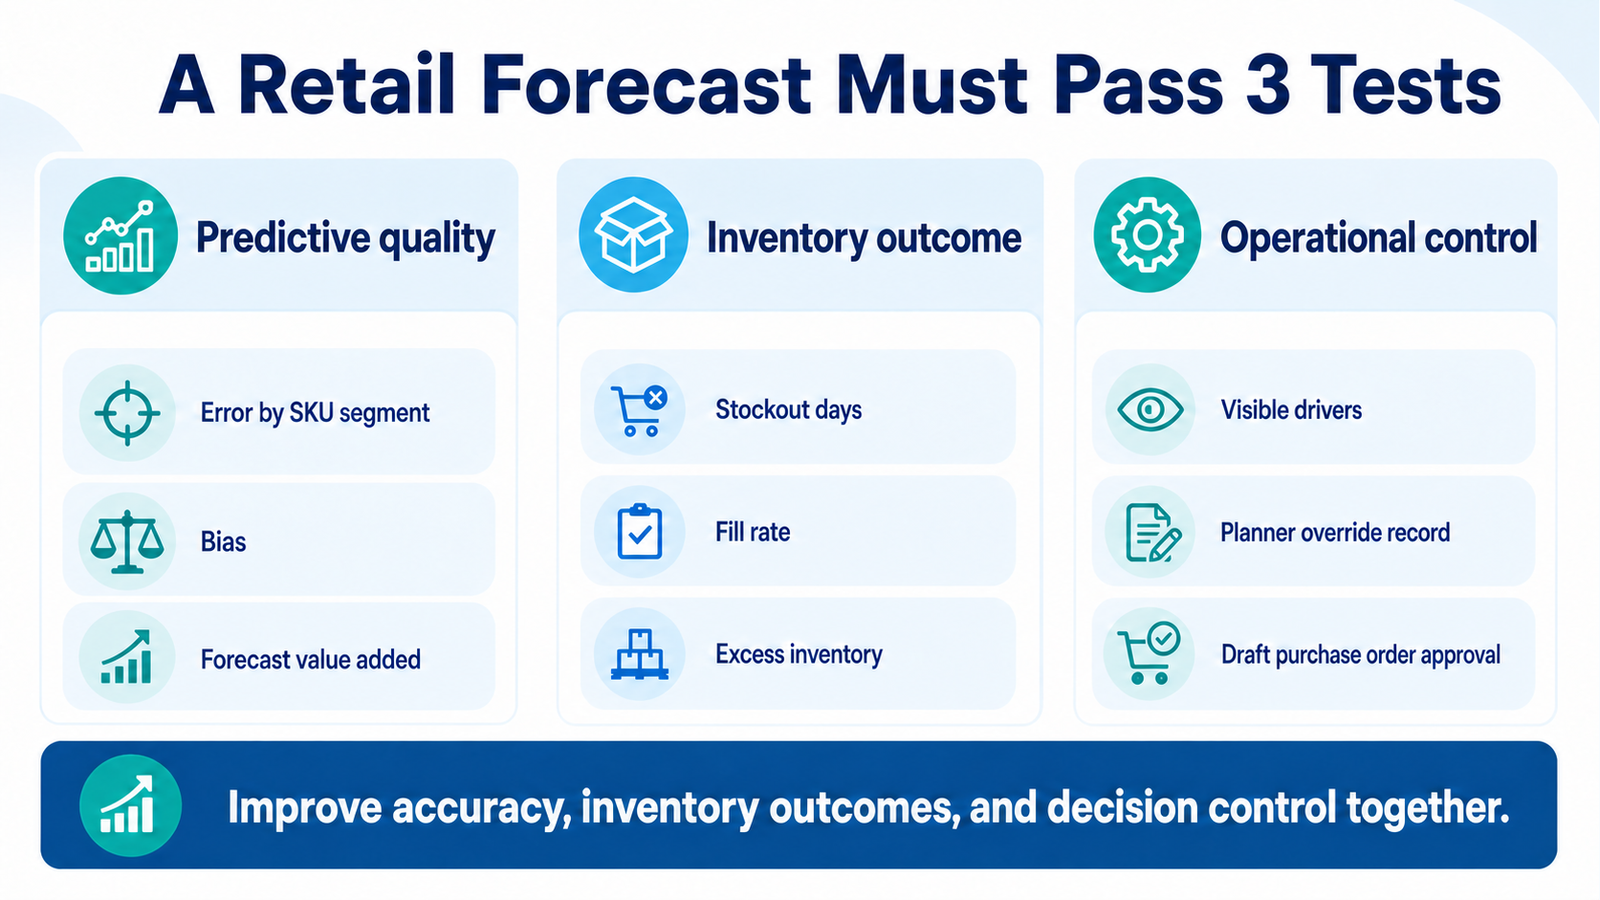
| Forecast value added | Tests whether the new method beats the current process |
| Override value added | Tests whether planner changes improve results |
No single metric tells the whole story. Percentage errors can behave poorly on intermittent or near-zero demand. Report segment-level results and the operational consequences of errors.
Step 5: Turn a forecast into a controlled reorder recommendation
A demand prediction is not a purchase order. By the end of this step, each recommendation should explain how the forecast, lead time, safety stock, current inventory, and inbound supply produced the proposed quantity and date.
A simplified structure is:
Reorder need = expected demand through lead time + safety stock - usable on-hand inventory - confirmed inbound inventory
The production rule must also account for case packs, minimum order quantities, shelf life, budget, warehouse capacity, supplier calendars, and substitution. Use supplier-specific actual lead-time performance where possible rather than one quoted value for every order.
Promotion periods and one-time events should be tagged. A Black Friday spike should not silently become the normal December or January baseline. Likewise, a price change, viral event, channel launch, or store closure needs explicit treatment.
Step 6: Design the planner review workflow
By the end of this step, a buyer or planner should be able to understand, approve, adjust, or reject each high-impact recommendation.
Show:
- Forecast range, not only one number
- Current and prior forecast
- Historical demand and availability
- Stockout-corrected periods
- Promotion and event flags
- Supplier lead time and reliability
- On-hand and inbound inventory
- Safety-stock assumption
- Recommended order date and quantity
- Main drivers and uncertainty
- Financial exposure
Keep proposed purchase orders in draft during the pilot. Capture overrides with a reason code. Later, compare whether overrides improved or reduced performance. This turns planner judgment into feedback rather than an invisible spreadsheet edit.
Step 7: Run a shadow pilot before operational rollout
Generate recommendations on schedule without placing orders automatically. Let planners make their normal decisions, then compare the system recommendation, planner decision, and actual outcome.
Monitor data freshness, failed integrations, missing SKUs, abnormal forecasts, and major deviations. Assign an owner for every alert. Re-run the historical test when the model, data pipeline, product hierarchy, promotion logic, or lead-time method changes.
After several planning cycles, expand only where the model creates forecast value and the workflow reduces decision effort without unacceptable risk. Some segments may remain manual or use simpler rules.
What success looks like
Success is not a lower model-error number in isolation. It is a better inventory decision process. Compare the pilot with the established baseline:
- Forecast error and bias by segment
- Stockout days and fill rate
- Excess inventory and weeks of supply
- Inventory turnover
- Expedite and cancellation cost
- Planner hours per cycle
- Percentage of recommendations approved or overridden
- Override value added
- Purchase-order errors
- Gross-margin or cash-flow impact where attribution is defensible
Agree on thresholds before viewing the results. A model should not be declared successful because one favorable metric improved after the test.
Common mistakes to avoid
Training on sales without availability. Stockout periods can hide demand and systematically understate replenishment needs.
Using one model for every SKU. Stable, seasonal, intermittent, new, and promotion-driven items behave differently.
Ignoring lead-time variability. A good demand forecast can still produce a bad order if the supply assumption is wrong.
Automating purchase orders too early. Begin with explained recommendations and human-approved drafts.
Reporting one accuracy average. Segment results and connect errors to stockouts, overstock, service, and cash.
Frequently asked questions
How much history does demand forecasting need?
It depends on seasonality, product lifecycle, frequency, and forecast horizon. A seasonal item often benefits from multiple comparable seasons, while a new product requires analogs, attributes, or a controlled manual plan.
Can a general-purpose language model forecast inventory?
It can help analyze data, explain patterns, or build prototypes, but purchasing decisions should rely on tested forecasting logic, reproducible data, validation, and human review. Fluent explanations do not prove predictive accuracy.
What if the business has frequent stockouts?
Reconstruct availability and flag censored periods before training. If the history cannot support a defensible estimate, keep the affected items in a high-review segment.
Should forecasts automatically create purchase orders?
They can create drafts after controls are proven. Final release should follow authority, budget, supplier, fraud, and inventory policies. High-value or unusual recommendations deserve human approval.
What is the best first pilot?
Choose a representative SKU group, one replenishment decision, a reliable data snapshot, and a baseline you can beat. Wavefront Studio can map the data and workflow through a free AI readiness audit before building a forecasting dashboard or integration.